11 Workshop 14: Questionnaire Data
Aims:
- To practice working with questionnaire data in preparation for data analysis (e.g., the process sometimes called data wrangling or “data cleaning”).
11.1 Tasks
Work in excel to remove any rows and columns that are not needed.
Remove participants who did not complete the study properly.
Check for any unusual responses.
Clean the data file variable names.
Check for missing responses across each participant.
Re-code any factor/categorical variables.
Reverse code any negative items.
Calculate the mean scores for the two questionnaires.
Produce basic descriptive statistics for each questionnaire.
11.2 1.Work in excel to remove any rows and columns that are not needed
Open the anxiety_procrastination.csv file (which can be found on Moodle).
This file contains data from participants who completed two questionnaires. The first was an academic anxiety questionnaire from Cassady et al. (2019) and the second was the general procrastination scale (short form) from Sirios et al. (2019). Participants were also asked their age and if they were a current UK university student.
Have a look at the excel file and make sure you understand what each column shows.
- Column
Cincludes progress data for the online study (% completed). - Column
Etells us if a participant completed the online study (1 = Yes, 0 = No). - Column
ForQ1 agetells us the participant age. - Column
GorQ2 unitells us if the participant is a current UK university student (1 = No, 2 = Yes). - Columns
HtoRare the Likert responses to questions on the academic anxiety scale (scale 1 - 5). - Columns
StoAAare the Likert responses to questions on the general procrastination scale (scale 1 - 5).
We need to remove any redundant columns or rows in the data file. This means any columns or rows which we don’t need for the analysis.
-
Remove columns
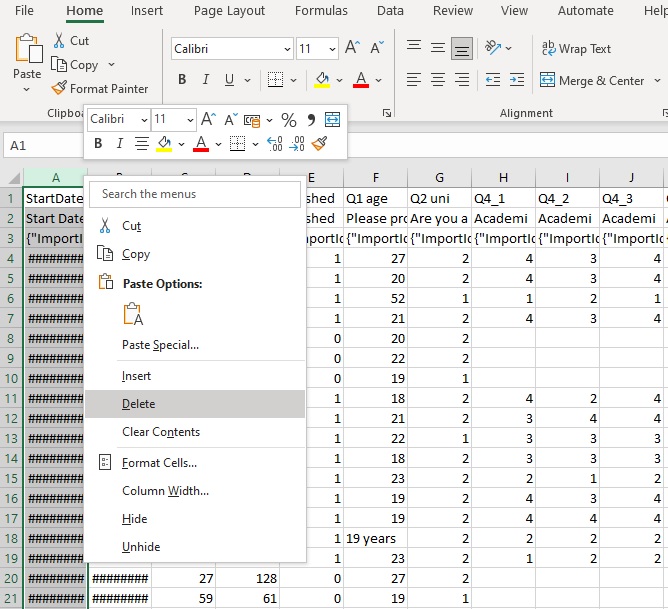
AandB.-Why? This just contains the start and end date/time for the participant and we do not need the analysis.
-
Remove rows
2and3.-Why? These contain meta-data in the file and we do not need them for the analysis.
To remove the column or row, click on the letter or number and right click then press delete
11.3 2. Remove participants who did not complete the study properly
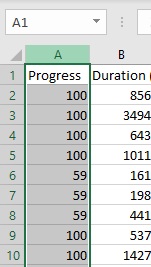
In excel we can sort the column which shows participant progress.
Click on this column (now column A) and sort it.
- Click on
A
- Click the
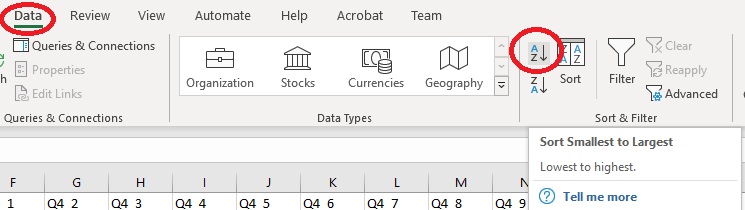
Datatab.
- Click the
Sort Smallest to Largestbutton.
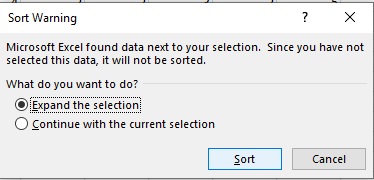
- Click sort with
expand the selectionselected.
- Delete any rows of participants who did not complete 100% of the study. Make a note on how many there were as you would want to report this in your lab report.
11.4 3. Check for any unusual responses
Look at the participant responses.
What do you notice in the Q1 age column?
Make any changes to the data file to make sure all of the ages are in the same format.
Hint
One of the participants has entered the age as 19 years.
Just change this so it says 19
Once you have done this, save the excel file as a .csv file called anxiety_procrastination2 and save it somewhere you can easily find it. You will need to save it in your RStudio working directory (see next step!)
11.5 4. Clean the data file variable names
Now we have tidying things up in excel, it is time to move over to RStudio.
Load the following libraries, set your working directory, and import the data file.
install.packages("janitor")
install.packages("psych")
library(tidyverse)
library(janitor)
library(psych)

mydata <- read_csv("anxiety_procrastination2.csv")
This next bit of code will tidy up our data file in RStudio.
We will also create a new object to work with called clean_mydata.
# clean_names will:
#(1) change any capital letters to lowercase,
#(2) remove any spaces and replace with an underscore,

clean_mydata <- mydata %>%
  clean_names()
11.6 5. Check for missing responses across each participant
Sometimes a participant might accidentally miss a question. We need to check for this to see how many participants might have missing data.
clean_mydata <- clean_mydata %>%               #this will make sure a new column is added.
  mutate(missing_count = rowSums(is.na(.)))    #this will count up the missing responses.

view(clean_mydata)
When you view the data it will open in a new tab.
Scroll to the very end and you’ll see there is a new column called missing_count.
What has happened?
The code above created a new column with the sum of the total number of missing responses.
How many participants had missing data?
How many responses did they each miss?
Because the number of missing responses is quite low we can move on. But if you have a participant who has missed more than 25% of their responses, you might consider removing them from the data file.
11.7 6. Re-code any factor/categorical variables
There is one categorical variable.
q2_uni is a No and Yes question (“Are you a current UK University student?”)
Run this code to re-code the variable:
clean_mydata$q2_uni <- factor(clean_mydata$q2_uni)This code will take the q2_uni variable and set it as factor.
11.8 7. Reverse code any negative items
The general procrastination scale has three reverse coded items:
q5_3q5_5q5_6
We need to reverse code these so that the Likert scores are swapped. This means:
5 becomes a 1
4 becomes a 2
3 stays as a 3
2 becomes a 4
1 becomes a 5
If you are unsure what is meant by a negative or reverse coded item, check the lecture slides.
Run the following code:
# we need to reverse code 3 items for the procrastination questionnaire
clean_mydata$q5_3 <- 6 - clean_mydata$q5_3
clean_mydata$q5_5 <- 6 - clean_mydata$q5_5
clean_mydata$q5_6 <- 6 - clean_mydata$q5_6

# we use the number 6 because there were 5 response options
# if you had a 7 point Likert scale, this should say 8.
# if you had a 9 point Likert scale, this would say 10.
#change the number so it is one more than the number of Likert options.
11.9 8. Calculate the mean scores for the two questionnaires
At the moment we have a cleaned data file with all of the individual question responses.
However, for each participant we need a mean score for each questionnaire/scale.
For each participant we need:
The overall (
mean) academic anxiety questionnaire score.The overall (
mean) procrastination questionnaire score.
We can do this and create new variables for these means using the code below.
# Select and calculate the anxiety scale score
clean_mydata <- clean_mydata %>%
  mutate(anxiety = rowMeans(select(., starts_with("q4_")), na.rm = TRUE))

# Select and calculate the procrastination scale score
clean_mydata <- clean_mydata %>%
  mutate(procrastination = rowMeans(select(., starts_with("q5_")), na.rm = TRUE))
Let’s explain this code bit by bit so you can adapt it again in the future:
clean_mydata <- clean_mydata %>% to specify which data file to create the new column.
mutate() will add the new column.
anxiety = is what you want to call the new column.
rowMeans will calculate the means across items/questions.
select is so we will only do this for a certain number of items.
starts_with("q4_") is so any variable that begins with q4_ is counted (e.g., q4_1 through to q4_11).
na.rm = TRUE is important as it will tell R to ignore any missing values when calculating the mean.
11.10 9. Produce basic descriptive statistics for each questionnaire
If you view your data file, you should see at the very end (final two columns) you should have the mean anxiety and procrastination scores for each participant. To view the data file, just run:
# Select and calculate the anxiety scale score
view(clean_mydata)
Across our sample, let’s just finish by looking at some descriptive statistics.
Run the following code and looks through and interpret the output.
clean_mydata %>%                                     # which data file
  select(q1_age, anxiety, procrastination) %>%       # select what variables to include
  describe() %>%                                     # describe the data
  select(n, mean, sd, se, min, max)                  # describe() will give us some stats

# optional: try removing the first select() function from the code and see what happens
clean_mydata %>%                                     # which data file
  describe() %>%                                     # describe the data
  select(n, mean, sd, se, min, max)                  # describe() will give us some stats

#hopefully you will see why we used select() as otherwise it will give us values for every single question.
#it might be useful to look at every single question, but for today we just wanted the mean values for the questionnaires.
11.11 10. Optional Exercise
Working more with data:
11.11.1 Optional Exercise One
q2_uni asks participants “Are you a current UK University student?”.
Let’s say our inclusion criteria stated that we want to only use data from current university students, we then need to filter out anyone who answered No.
No = 1 and Yes = 2 for this variable.
clean_mydata <- clean_mydata %>%
  filter(q2_uni == 2)

#filter(q2_uni ==2) will include ONLY participants who
Well Done. You have reached the end of the workshop